Reporters
Spana ships five reporters. Use one or combine several to get both human-readable output and machine-readable artifacts from the same run.
Enabling reporters
Section titled “Enabling reporters”CLI flag (one or more):
spana test --reporter console --reporter htmlConfig file (spana.config.ts):
export default defineConfig({ reporters: ["console", "html"],});Multiple reporters run simultaneously. Each receives the same flow results as they complete.
Console (default)
Section titled “Console (default)”Human-readable terminal output with pass/fail symbols, per-platform summaries, and failure details.
Enable: active by default. Explicitly: --reporter console.
Output: stdout.
  ✓ [web] login flow (1243ms)  ✗ [android] login flow (3891ms)
web (Playwright)              ✓  1/1 passed (1.2s)android (UiAutomator2)        ✗  0/1 passed (3.9s)
--- Failures ---✗ [android] login flow  Timed out waiting for selector "welcome-text"
1/2 passed, 1 failed (3.9s)
Flaky tests (passed on retry) are marked with ~ and show the attempt number. Scenario steps (Given/When/Then) are printed inline when using Gherkin-style flows.
When to use: local development and quick CI feedback.
Streams newline-delimited JSON events to stdout. Each line is a self-contained JSON object.
Enable: --reporter json
Output: stdout (one JSON object per line).
Events emitted:
| Event | When |
|---|---|
flowPass | A flow finishes successfully |
flowFail | A flow fails |
runComplete | All flows have finished; includes full summary |
{"event":"flowPass","name":"login flow","platform":"web","status":"passed","durationMs":1243}{"event":"flowFail","name":"login flow","platform":"android","status":"failed","durationMs":3891,"error":{"message":"Timed out"}}{"event":"runComplete","total":2,"passed":1,"failed":1,"skipped":0,"flaky":0,"durationMs":3891}When to use: piping results into other tools, custom dashboards, or CI scripts that parse structured output.
Generates a JUnit XML file compatible with Jenkins, GitHub Actions, GitLab CI, and most CI systems that consume test reports.
Enable: --reporter junit
Output: <outputDir>/junit-report.xml (default ./spana-output/junit-report.xml).
<?xml version="1.0" encoding="UTF-8"?><testsuites name="spana" tests="2" failures="1" time="3.891"> <testsuite name="web" tests="1" failures="0" skipped="0" time="1.243"> <testcase name="login flow" classname="spana.web" time="1.243"/> </testsuite> <testsuite name="android" tests="1" failures="1" skipped="0" time="3.891"> <testcase name="login flow" classname="spana.android" time="3.891"> <failure message="Timed out waiting for selector">...</failure> </testcase> </testsuite></testsuites>Results are grouped by platform into <testsuite> elements. Scenario steps, driver steps, and attachments are included in <system-out> when present.
When to use: CI pipelines that display JUnit test results (GitHub Actions test-reporter, Jenkins JUnit plugin, GitLab test reports).
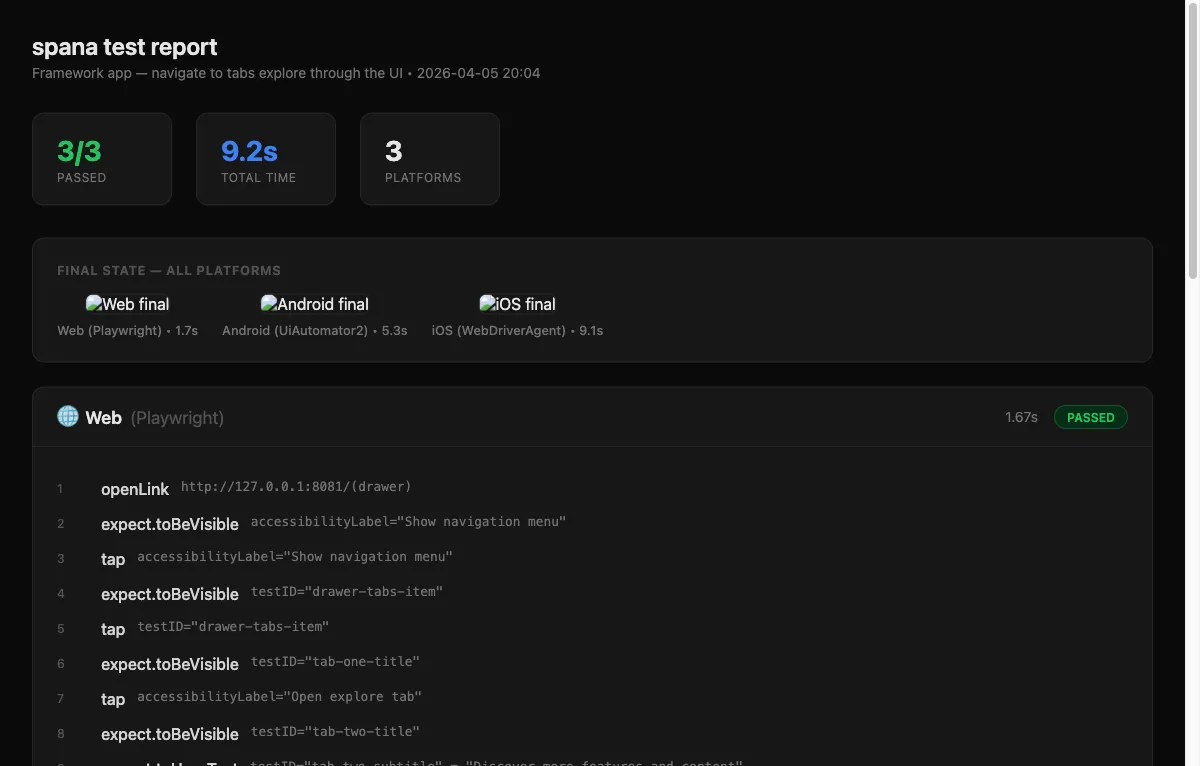
Self-contained HTML report with a dark theme, responsive layout, and embedded screenshots (base64-inlined so no external files are needed).
Enable: --reporter html
Output: <outputDir>/report.html (default ./spana-output/report.html).
The report includes:
- Summary cards — passed/total, total time, platform count.
- Per-platform sections — status badge, duration, driver and scenario steps.
- Step screenshots — inline images from each step that captured a screenshot.
- Final-state screenshots — side-by-side comparison of the final screen on each platform.
- Failure details — error messages displayed inline.
When to use: sharing results with teammates, reviewing visual state after a run, or archiving test evidence.
Allure
Section titled “Allure”Generates Allure result files for rich CI dashboards with history, trends, and categorized failures.
Enable: --reporter allure
Output: allure-results/ directory (default), containing *-result.json files and an environment.properties file.
# Run tests with Allure reporterspana test --reporter console,allure
# Generate and open the Allure reportnpx allure generate allure-results --clean -o allure-reportnpx allure open allure-report
The reporter produces:
- Result files — one JSON file per flow with UUID, history ID, labels, steps, and timing
- Attachments — screenshots and hierarchy dumps copied into the output directory
- Environment properties — platform, framework name, pass/fail counts
- Flaky detection — tests that pass on retry are tagged as
flakywith attempt count - Step mapping — spana steps (tap, assertVisible, etc.) map to Allure test steps with status and duration
When to use: CI dashboards that support Allure (Jenkins Allure Plugin, GitHub Actions with allure-report action, GitLab with Allure integration).
Combining reporters
Section titled “Combining reporters”A common setup for CI:
export default defineConfig({ reporters: ["console", "junit", "html"],});This gives you live terminal feedback, a JUnit file for CI test-result ingestion, and an HTML report to upload as a build artifact.
Custom reporters
Section titled “Custom reporters”Need a reporter that isn’t built in? See Custom Reporters to learn how to write your own using spana’s Reporter interface.