Studio
Spana Studio is a local web interface that bundles an Element Inspector and a Test Runner Dashboard into a single tool. It lets you visually inspect device screens, explore element trees, and run test flows with real-time feedback — all from your browser.
Launching Studio
Section titled “Launching Studio”spana studio [options]Options
Section titled “Options”| Flag | Description |
|---|---|
--port <number> | Port to serve on (default: 4400) |
--no-open | Don’t auto-open the browser |
--config <path> | Path to config file (default: ./spana.config.ts) |
# Start on the default port and open the browserspana studio
# Use a custom port, skip auto-openspana studio --port 4000 --no-open
# Point at a non-default configspana studio --config ./config/spana.staging.ts
Element Inspector
Section titled “Element Inspector”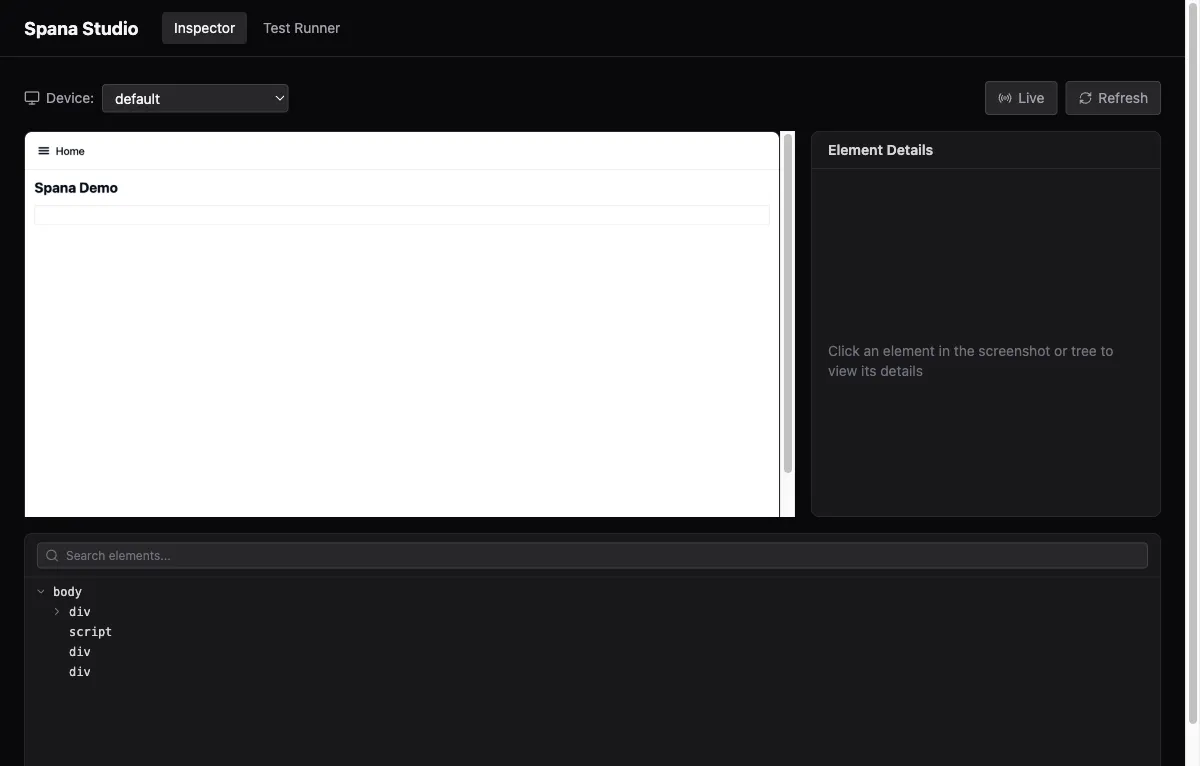
Connect to a running device or simulator, then interact with a live screenshot of the current screen.
- Tap to inspect — click any element in the screenshot to see its properties (testID, text, accessibility label, bounds).
- Element tree — browse the full hierarchy in a sidebar tree view.
- Copy selectors — one-click copy of the best selector for any element, ready to paste into a flow file.
This gives you the same information as spana selectors and spana hierarchy, but in a visual, point-and-click workflow.
Test Runner Dashboard
Section titled “Test Runner Dashboard”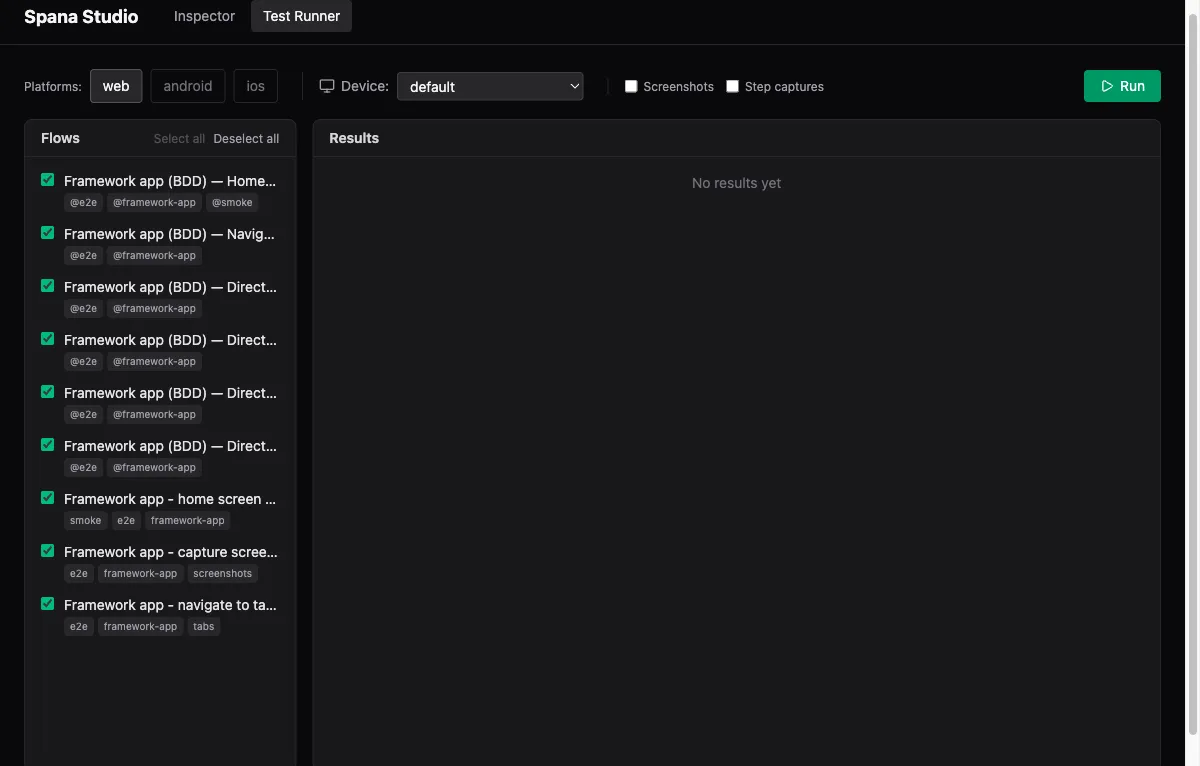
Discover and run flow files without leaving the browser.
- Flow discovery — automatically lists all flows found under your configured
flowDir. - Device selector — pick which device, emulator, or simulator to run tests on from a dropdown in the toolbar.
- Run tests — execute one or many flows with real-time progress updates.
- Step details — expand any step to see its status, duration, and captured screenshot.
Capture toggles
Section titled “Capture toggles”Two checkboxes control screenshot capture during a run:
| Toggle | Behavior |
|---|---|
| Screenshots | Capture a screenshot on each successful step |
| Step captures | Capture per-step screenshots (useful for visual debugging) |
Session persistence
Section titled “Session persistence”Test results persist across tab switches within the same Studio session. You can jump between the Inspector and the Runner without losing run history or step details.
How it works
Section titled “How it works”Studio is an embedded React frontend served directly from the CLI binary — no separate install required. The frontend communicates with the CLI backend through an oRPC API layer, giving you type-safe requests between the browser and device connections.
Development
Section titled “Development”If you’re working on Studio itself, run the Vite dev server with hot reload:
cd apps/studiobun run devThe dev frontend connects directly to the CLI backend at http://localhost:4400.